Event Profiler and Counters Instruments
October 18th, 2011
Filed under: Instruments | Be the first to comment!
Xcode 4.2 adds two instruments for Mac applications that users of the Shark performance tool will appreciate. The Event Profiler instrument records a sample when a low-level event occurs. The Counters instrument samples your application and collects PMC (Performance Monitor Counter) events. PMC events are low-level CPU events, such as incorrectly predicted branches and cache misses.
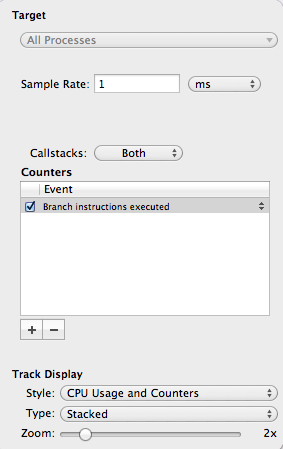
Before you trace with the Event Profiler and Counters instruments, you must first configure them. Click the Info button next to the instrument in the instrument list to open a pop-up editor. The pop-up editor is where you configure the instrument. You must tell the Event Profiler instrument the event that triggers sampling. Choose an event from the Event Name menu.

You must specify the PMC events to collect to use the Counters instrument. Click the + button to add an event to the Counters list. Choose an event from the pop-up cell.
When you choose PMC events to collect for the Counters instrument, Instruments shows only a subset of the available PMC events. Choose Window > Manage PM Events to control the PMC events the Counters instrument can collect.
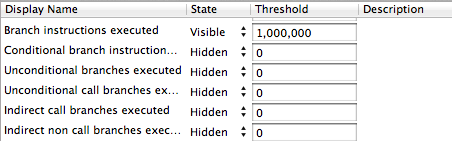
Most of the PMC events are hidden initially. Choose Visible from the State pop-up cell to make that event visible. When you add an event for the Counters instrument to collect, the event you made visible should be one of the choices in the pop-up cell.
Tags: xcode 4